|
Novus Biologicals
atg5 antibody  Atg5 Antibody, supplied by Novus Biologicals, used in various techniques. Bioz Stars score: 93/100, based on 1 PubMed citations. ZERO BIAS - scores, article reviews, protocol conditions and more https://www.bioz.com/product/biolog+phenotype+microarray+pm+1%E2%80%9310+plates/ATG5+Antibody/bio_rxiv__2025__05__02__651776-129-21-23 Average 93 stars, based on 1 article reviews
atg5 antibody - by Bioz Stars,
2026-09
93/100 stars
|
Buy from Supplier |
|
Novus Biologicals
fzd10  Fzd10, supplied by Novus Biologicals, used in various techniques. Bioz Stars score: 90/100, based on 1 PubMed citations. ZERO BIAS - scores, article reviews, protocol conditions and more https://www.bioz.com/product/biolog+phenotype+microarray+pm+1%E2%80%9310+plates/Frizzled-10+Antibody+(2678A)+%5BmFluor+Violet+500+SE%5D/pm25406648-350-31-34 Average 90 stars, based on 1 article reviews
fzd10 - by Bioz Stars,
2026-09
90/100 stars
|
Buy from Supplier |
|
Corning Life Sciences
epoxy-coated microarray slides Epoxy Coated Microarray Slides, supplied by Corning Life Sciences, used in various techniques. Bioz Stars score: 90/100, based on 1 PubMed citations. ZERO BIAS - scores, article reviews, protocol conditions and more https://www.bioz.com/product/biolog+phenotype+microarray+pm+1%E2%80%9310+plates/epoxide+coated+microarray+slides/pmc04082371-166-11-14 Average 90 stars, based on 1 article reviews
epoxy-coated microarray slides - by Bioz Stars,
2026-09
90/100 stars
|
Buy from Supplier |
|
Novus Biologicals
flow cytometry Flow Cytometry, supplied by Novus Biologicals, used in various techniques. Bioz Stars score: 94/100, based on 1 PubMed citations. ZERO BIAS - scores, article reviews, protocol conditions and more https://www.bioz.com/product/biolog+phenotype+microarray+pm+1%E2%80%9310+plates/ARNT%2FHIF-1+beta+Antibody/pm36857181-128-137-139 Average 94 stars, based on 1 article reviews
flow cytometry - by Bioz Stars,
2026-09
94/100 stars
|
Buy from Supplier |
|
Aviva Systems
antibodies for dek  Antibodies For Dek, supplied by Aviva Systems, used in various techniques. Bioz Stars score: 86/100, based on 1 PubMed citations. ZERO BIAS - scores, article reviews, protocol conditions and more https://www.bioz.com/product/biolog+phenotype+microarray+pm+1%E2%80%9310+plates/DEK+Antibody+-+C-terminal+region+(OAAB05777)/pmc03117026-164-33-37 Average 86 stars, based on 1 article reviews
antibodies for dek - by Bioz Stars,
2026-09
86/100 stars
|
Buy from Supplier |
|
Proteintech
cotl1  Cotl1, supplied by Proteintech, used in various techniques. Bioz Stars score: 93/100, based on 1 PubMed citations. ZERO BIAS - scores, article reviews, protocol conditions and more https://www.bioz.com/product/biolog+phenotype+microarray+pm+1%E2%80%9310+plates/COTL1+Antibody/pmc09856320-45-17-18 Average 93 stars, based on 1 article reviews
cotl1 - by Bioz Stars,
2026-09
93/100 stars
|
Buy from Supplier |
|
ATCC
forskolin deposited embl ebi e mtab 13352 microarray clariomd human bewo ko wt Forskolin Deposited Embl Ebi E Mtab 13352 Microarray Clariomd Human Bewo Ko Wt, supplied by ATCC, used in various techniques. Bioz Stars score: 93/100, based on 1 PubMed citations. ZERO BIAS - scores, article reviews, protocol conditions and more https://www.bioz.com/product/biolog+phenotype+microarray+pm+1%E2%80%9310+plates/Penicillium+melinii+Thom%2C+anamorph/pm38439971-193-78-108 Average 93 stars, based on 1 article reviews
forskolin deposited embl ebi e mtab 13352 microarray clariomd human bewo ko wt - by Bioz Stars,
2026-09
93/100 stars
|
Buy from Supplier |
|
Sino Biological
mouse monoclonal anti klk10  Mouse Monoclonal Anti Klk10, supplied by Sino Biological, used in various techniques. Bioz Stars score: 95/100, based on 1 PubMed citations. ZERO BIAS - scores, article reviews, protocol conditions and more https://www.bioz.com/product/biolog+phenotype+microarray+pm+1%E2%80%9310+plates/Influenza+A+H3N2+(A%2FBrisbane%2F10%2F2007)+Hemagglutinin+%2F+HA+Antibody%2C+Mouse+MAb/pmc11169620-198-26-30 Average 95 stars, based on 1 article reviews
mouse monoclonal anti klk10 - by Bioz Stars,
2026-09
95/100 stars
|
Buy from Supplier |
|
Enzo Biochem
tcda  Tcda, supplied by Enzo Biochem, used in various techniques. Bioz Stars score: 90/100, based on 1 PubMed citations. ZERO BIAS - scores, article reviews, protocol conditions and more https://www.bioz.com/product/biolog+phenotype+microarray+pm+1%E2%80%9310+plates/tcda/pmc06242954-141-5-8 Average 90 stars, based on 1 article reviews
tcda - by Bioz Stars,
2026-09
90/100 stars
|
Buy from Supplier |
|
Corning Life Sciences
6-well plates 6 Well Plates, supplied by Corning Life Sciences, used in various techniques. Bioz Stars score: 90/100, based on 1 PubMed citations. ZERO BIAS - scores, article reviews, protocol conditions and more https://www.bioz.com/product/biolog+phenotype+microarray+pm+1%E2%80%9310+plates/96+well+plates/10__1007_slash_s12645___011___0013___9-0-7-9 Average 90 stars, based on 1 article reviews
6-well plates - by Bioz Stars,
2026-09
90/100 stars
|
Buy from Supplier |
|
Corning Life Sciences
ultragaps coated glass slides Ultragaps Coated Glass Slides, supplied by Corning Life Sciences, used in various techniques. Bioz Stars score: 90/100, based on 1 PubMed citations. ZERO BIAS - scores, article reviews, protocol conditions and more https://www.bioz.com/product/biolog+phenotype+microarray+pm+1%E2%80%9310+plates/ultragaps+glass+slides/pmc02698405-125-48-53 Average 90 stars, based on 1 article reviews
ultragaps coated glass slides - by Bioz Stars,
2026-09
90/100 stars
|
Buy from Supplier |
|
Enzo Biochem
megacd40l  Megacd40l, supplied by Enzo Biochem, used in various techniques. Bioz Stars score: 90/100, based on 1 PubMed citations. ZERO BIAS - scores, article reviews, protocol conditions and more https://www.bioz.com/product/biolog+phenotype+microarray+pm+1%E2%80%9310+plates/megacd40l/pmc05519504-409-47-48 Average 90 stars, based on 1 article reviews
megacd40l - by Bioz Stars,
2026-09
90/100 stars
|
Buy from Supplier |
Image Search Results
Journal: bioRxiv
Article Title: Loss of ATG5 expression in a subset of human prostate cancers promotes tumor growth through accumulation of p62
doi: 10.1101/2025.05.02.651776
Figure Lengend Snippet: ( A ) Visualization of the deletions, amplifications, and somatic mutations of ATG5 and other PCa-associated genes from the TCGA prostate adenocarcinoma (PRAD) dataset (n = 492). The image was exported from cBioPortal. ( B ) Genome-wide somatic copy number alterations (SCNAs) from 97 curated and paired TCGA PRAD samples. Frequently altered autophagy-related (ATG) genes are highlighted below, along with neighboring oncogenes or tumor suppressor genes. The image was exported from Nexus Copy Number™. ( C ) Oncomine™ analysis of microarray mRNA expression datasets for ATG5 and other PCa-associated genes. Genes are ranked based on the significance of mRNA under-expression in prostate tumors compared to normal tissue. Genes ranking in the top 25%, 10%, 5% and 1% of all examined genes in a given dataset are indicated with increasingly deep blue color. The p-value for a given gene was calculated from the median ranks across all 15 microarray datasets. ( D ) Oncomine™ analysis of PCa-related genes for prostate metastases compared to primary tumors. See also Supplementary Figure S1 and Supplementary Figure S2A.
Article Snippet: Slides were cooled for 20 min, washed with water, blocked with Biocare Blocking Reagent (#BS966M) for 10 min and incubated in
Techniques: Genome Wide, Microarray, Expressing
![( A ) Tukey boxplot of ATG5 mRNA expression levels in normal prostate tissue, low-grade (Gleason score ≤7) tumors, and high-grade (Gleason score >8) tumors from the TCGA PRAD dataset (*, p<0.01; **, p<0.0001). ( B ) Kaplan-Meier curves comparing overall survival of TCGA PRAD patients possessing tumors with high or low ATG5 mRNA expression. The Mantel-Haenszel hazard ratio (HR) was determined, along with the 95% confidence interval (CI) and Log-rank test p-value (p<0.05). ( C ) Quantification of ATG5 IHC staining was determined from patient samples (N=28) with ≥3 benign and tumor glands for in-patient comparison using the following equation: H-score = [1 x (% cells 1+) + 2 x (% cells 2+) + 3 x (% cells 3+)]. Statistical significance (p<0.0001) was determined using a two-tailed Mann Whitney test in Prism10. ( D ) Representative images of ATG5 staining from benign glandular regions and tumor regions from human prostate tumors of GS7-9. Scale bar represents 100 μm. Dashed box areas are magnified within the insets.](https://bio-rxiv-images-cdn.bioz.com/dois_ending_with_76/10__1101_slash_2025__05__02__651776/10__1101_slash_2025__05__02__651776___F2.large.jpg)
Journal: bioRxiv
Article Title: Loss of ATG5 expression in a subset of human prostate cancers promotes tumor growth through accumulation of p62
doi: 10.1101/2025.05.02.651776
Figure Lengend Snippet: ( A ) Tukey boxplot of ATG5 mRNA expression levels in normal prostate tissue, low-grade (Gleason score ≤7) tumors, and high-grade (Gleason score >8) tumors from the TCGA PRAD dataset (*, p<0.01; **, p<0.0001). ( B ) Kaplan-Meier curves comparing overall survival of TCGA PRAD patients possessing tumors with high or low ATG5 mRNA expression. The Mantel-Haenszel hazard ratio (HR) was determined, along with the 95% confidence interval (CI) and Log-rank test p-value (p<0.05). ( C ) Quantification of ATG5 IHC staining was determined from patient samples (N=28) with ≥3 benign and tumor glands for in-patient comparison using the following equation: H-score = [1 x (% cells 1+) + 2 x (% cells 2+) + 3 x (% cells 3+)]. Statistical significance (p<0.0001) was determined using a two-tailed Mann Whitney test in Prism10. ( D ) Representative images of ATG5 staining from benign glandular regions and tumor regions from human prostate tumors of GS7-9. Scale bar represents 100 μm. Dashed box areas are magnified within the insets.
Article Snippet: Slides were cooled for 20 min, washed with water, blocked with Biocare Blocking Reagent (#BS966M) for 10 min and incubated in
Techniques: Expressing, Immunohistochemistry, Comparison, Two Tailed Test, MANN-WHITNEY, Staining
Journal: bioRxiv
Article Title: Loss of ATG5 expression in a subset of human prostate cancers promotes tumor growth through accumulation of p62
doi: 10.1101/2025.05.02.651776
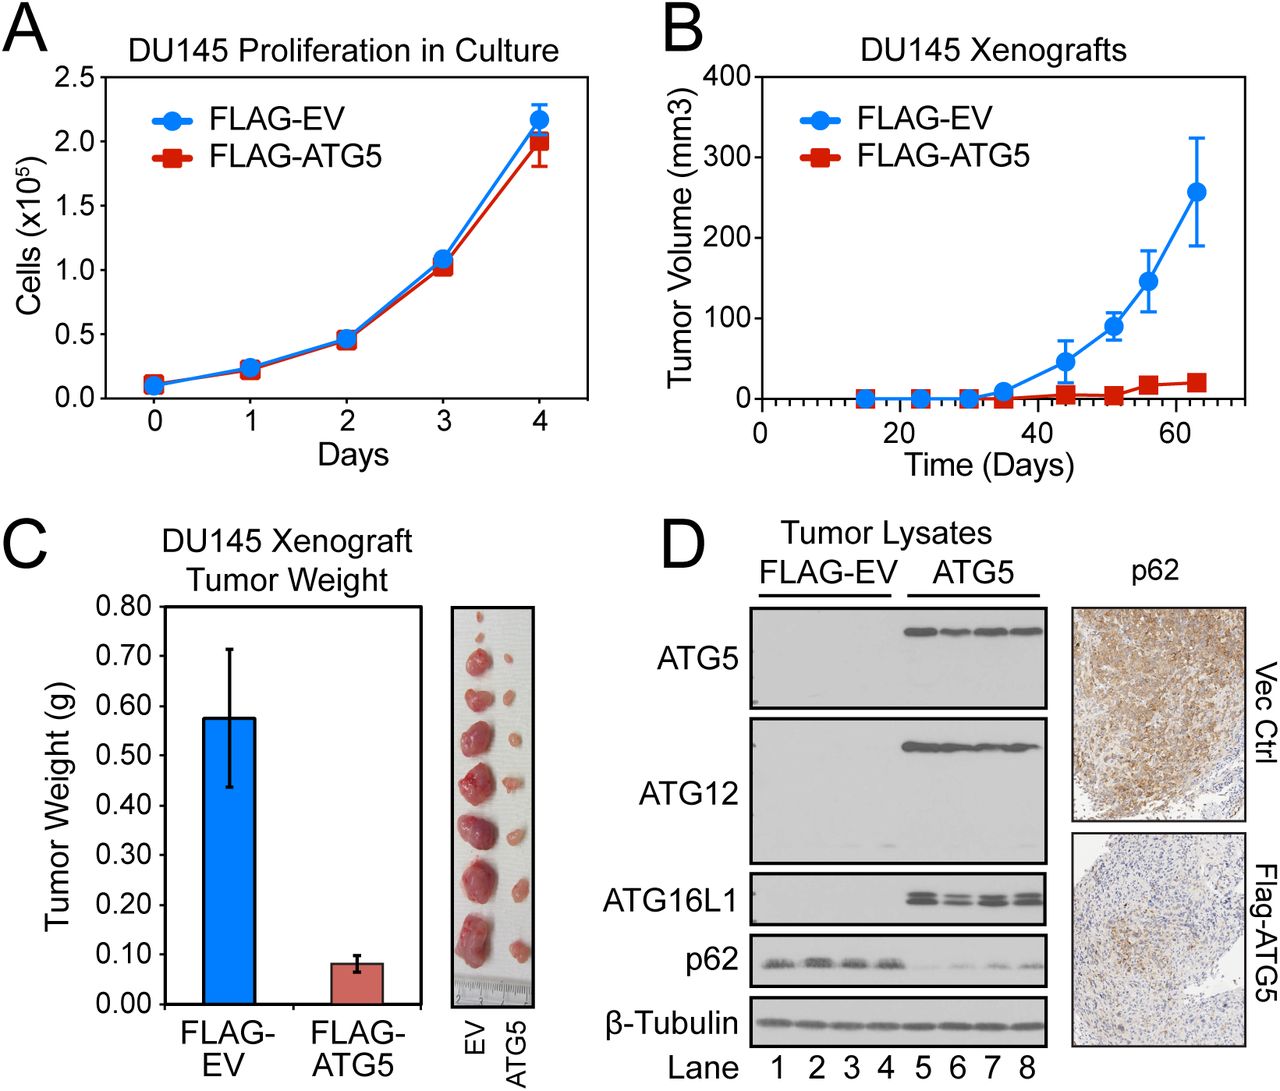
Figure Lengend Snippet: (A and B) 1×10 4 DU145 PCa cells, stably expressing firefly luciferase fused to mCherry and an empty vector (EV) or FLAG-ATG5, were plated in duplicate into 6-well plates. Total cell numbers were quantified daily by flow cytometry for 5 days. The same cell lines were likewise injected subcutaneously into the flanks of NOD/SCID mice, and xenograft tumor growth was determined by weekly measurements of luciferase activity using the IVIS Spectrum in vivo imaging system. (C) Mice were sacrificed and the tumors from empty vector (EV) and FLAG-ATG5-expressing DU145 xenografts were harvested, weighed and photographed. (D) Lysates were prepared from EV (lanes 1-4) and FLAG-ATG5-expressing tumors (lanes 5-8) and immunoblotted for the ATG12–ATG5-ATG16L1 complex and p62. IHC was also performed for p62 on representative tumors.
Article Snippet: Slides were cooled for 20 min, washed with water, blocked with Biocare Blocking Reagent (#BS966M) for 10 min and incubated in
Techniques: Stable Transfection, Expressing, Luciferase, Plasmid Preparation, Flow Cytometry, Injection, Activity Assay, In Vivo Imaging

Journal: bioRxiv
Article Title: Loss of ATG5 expression in a subset of human prostate cancers promotes tumor growth through accumulation of p62
doi: 10.1101/2025.05.02.651776
Figure Lengend Snippet: ( A ) Tukey boxplot of p62 reverse phase protein array (RPPA) expression levels in low-grade (Gleason score ≤7) and high-grade (Gleason score >8) tumors from the TCGA PRAD RPPA dataset. ***, p<0.0001. (B) Kaplan-Meier curves comparing overall survival of TCGA PRAD patients possessing tumors with high or low p62 RPPA expression. The Mantel-Haenszel hazard ratio (HR) was determined, along with the 95% confidence interval (CI) and Log-rank test p-value (p<0.05). ( C ) Tukey boxplot of SQSTM1 mRNA expression levels in low-grade (Gleason score ≤7) and high-grade (Gleason score >8) tumors from the TCGA PRAD dataset. **, p<0.001; ns, not significant. ( D ) Structure of p62 with its various functional domains and impacted signaling pathways. ( E ) DU145 cells were made deficient in p62 through CRISPR/Cas9-mediated deletion of SQSTM1 , and then infected with ATG5-expressing lentiviruses. ( F ) Wild-type and p62-deficient (p62 KO) cells – as well as those expressing ATG5 (DU145-ATG5 and DU145-ATG5-p62 KO) – were injected into both flanks of female NOD/SCID mice (0.5 x 10 6 cells per injection) and the resulting tumors were measured twice per week using calipers. Wild-type DU145 cells produced tumors larger than any other group by day 46 (p<0.01), and DU145-ATG5 cells produced tumors larger than p62-deficient cells only on day 63 (p<0.01). ( F ) Proposed model for how loss of ATG5 results in increased tumor growth.
Article Snippet: Slides were cooled for 20 min, washed with water, blocked with Biocare Blocking Reagent (#BS966M) for 10 min and incubated in
Techniques: Protein Array, Expressing, Functional Assay, Protein-Protein interactions, CRISPR, Infection, Injection, Produced
Journal: Nature communications
Article Title: BRMS1L suppresses breast cancer metastasis by inducing epigenetic silence of FZD10.
doi: 10.1038/ncomms6406
Figure Lengend Snippet: Figure 3 | BRMS1L inhibits breast cancer cell invasion and EMT via suppressing FZD10 expression. (a) mRNA microarray (GSE61354) analysis reveals mRNA differentially expressed in MDA-MB-231 cells transfected with pcDNA3 vector carrying BRMS1L (BRMS1L) or negative control (NC) for 24 h. (b) qRT–PCR for the mRNA expression of WNT2B, WNT7A, WNT9B, WNT10B, FRAT1, FZD10, VANGL2, BMP8A, CAMK3B in mRNA microarray. ***Po0.001 as compared with NC. Bars correspond to mean±s.d. The data are representative of three independent experiments. Student’s t-test was used for the comparison of two independent groups. (c) Western blotting for BRMS1L and FZD10 in T47D cells that were untreated (UT), mock transfected (mock) or transfected with GFP-siRNA or two BRMS1L-siRNAs. (d) Western blotting for BRMS1L and FZD10 in MDA-MB-231 cells that were transfected with pcDNA3 vector carrying BRMS1L (BRMS1L) or negative control (NC). (e) E-cadherin and vimentin protein expression levels measured by western blotting in MCF-10A cells that were untreated (UT), mock transfected (mock) or transfected with GFP-siRNA or two FZD10-siRNAs. (f,g) Invasion of cancer cells measured by Boyden chamber assays for BT-474 (f) and MDA-MB-231 cells (g) treated as indicated. Bars correspond to mean±s.d. ***Po0.001 as compared with mock. Scale bars correspond to 50 mm. Student’s t-test was used for the comparison of two independent groups. (h) Immunohistochemical staining for FZD10 in primary breast cancer with or without regional lymph nodes (LN) metastasis and metastatic lymph nodes (LNMs). Scale bar corresponds to 50 mm. BRL, BRMS1L; E-cad, E-cadherin; Vim, Vimentin.
Article Snippet: Protein extracts were resolved in 8–15% SDS–polyacrylamide gel electrophoresis, transferred to polyvinylidene difluoride membranes and probed with antibodies against E-cadherin (1:1,000, 3195S, CST), vimentin (1:1,000, AF2105, R&D), BRMS1L (1:1,000, NBP2-14362, Novus),
Techniques: Expressing, Microarray, Transfection, Plasmid Preparation, Negative Control, Quantitative RT-PCR, Comparison, Western Blot, Immunohistochemical staining, Staining

Journal: Nature communications
Article Title: BRMS1L suppresses breast cancer metastasis by inducing epigenetic silence of FZD10.
doi: 10.1038/ncomms6406
Figure Lengend Snippet: Figure 5 | BRMS1L suppresses WNT3/FZD10/b-catenin pathway. (a) Wnt/b-catenin activity measured by TCF/LEF luciferase reporter assays in T47D cells that were mock transfected (mock), or transfected with GFP-siRNA or two BRMS1L-siRNAs and in MDA-MB-231 cells that were transfected with pcDNA3 vector carrying BRMS1L (BRMS1L) or negative control (NC). Bars correspond to mean±s.d., ***Po0.001 as compared with GFP-siRNA, ###Po0.001 as compared with NC. (b,c) Wnt/b-catenin activities measured by TCF/LEF luciferase assays in MDA-MB-231 (b) and T47D cells (c) treated as indicated. Bars correspond to mean±s.d. **Po0.001 as compared with BRMS1L or BRMS1L-siRNA1. (d,e) Western blotting for nuclear (n) and cytoplasm (c) b-catenin in MDA-MB-231 (d) and T47D cells (e) treated as indicated. (f,g) Wnt/b-catenin activities measured by TCF/LEF luciferase assays (f) and b-catenin translocation (g) in MDA-MB-231cells treated as indicated. ***Po0.001 as compared with GFP-siRNA. (h,i) Wnt/b-catenin activities measured by TCF/LEF b-catenin translocation (h) and luciferase assays (i) in T47D cells treated as indicated. ***Po0.001 as compared with BRMS1L-siRNA1. b-cat, b-catenin; BRL, BRMS1L. Bars correspond to mean±s.d. These data are representative of three independent experiments. Student’s t-test was used for the comparison of two independent groups in a,b,c,f,i.
Article Snippet: Protein extracts were resolved in 8–15% SDS–polyacrylamide gel electrophoresis, transferred to polyvinylidene difluoride membranes and probed with antibodies against E-cadherin (1:1,000, 3195S, CST), vimentin (1:1,000, AF2105, R&D), BRMS1L (1:1,000, NBP2-14362, Novus),
Techniques: Activity Assay, Luciferase, Transfection, Plasmid Preparation, Negative Control, Western Blot, Translocation Assay, Comparison

Journal: Nature communications
Article Title: BRMS1L suppresses breast cancer metastasis by inducing epigenetic silence of FZD10.
doi: 10.1038/ncomms6406
Figure Lengend Snippet: Figure 7 | BRMS1L inhibits liver metastasis of breast tumour xenografts without influencing orthotopic tumour incidence and growth rate. (a) The number of metastatic liver nodules in mice xenografted with breast cancer cells as indicated. The bars correspond to the mean±s.d. ***Po0.001 compared with GFP-shRNA. ###Po0.001 as compared with NC (n ¼ 8 per group). Student’s t-test was used for the comparison of two independent groups. (b) Expression of human HPRT mRNA relative to mouse 18S rRNA in the liver. Bars correspond to mean±s.d. Eight independent experiments were repeated (each mouse sample was considered as one independent experiment. Five technological replications were repeated in each sample.). Student’s t-test was used for the comparison of two independent groups. (c) Haematoxylin and eosin (H&E) staining for tumour xenografts and liver metastases of mice xenografted with breast cancer cells as indicated. Scale bars correspond to 50 mm. (d) Immunohistochemical staining for BRMS1L and FZD10 expression in tumour xenografts of mice xenografted with breast cancer cells as indicated. Scale bars correspond to 50 mm.BRL, BRMS1L.
Article Snippet: Protein extracts were resolved in 8–15% SDS–polyacrylamide gel electrophoresis, transferred to polyvinylidene difluoride membranes and probed with antibodies against E-cadherin (1:1,000, 3195S, CST), vimentin (1:1,000, AF2105, R&D), BRMS1L (1:1,000, NBP2-14362, Novus),
Techniques: shRNA, Comparison, Expressing, Staining, Immunohistochemical staining

Journal: Nature communications
Article Title: BRMS1L suppresses breast cancer metastasis by inducing epigenetic silence of FZD10.
doi: 10.1038/ncomms6406
Figure Lengend Snippet: Figure 8 | Schematic summary of the miR106b-BRMS1L-FZD10 signalling pathway.
Article Snippet: Protein extracts were resolved in 8–15% SDS–polyacrylamide gel electrophoresis, transferred to polyvinylidene difluoride membranes and probed with antibodies against E-cadherin (1:1,000, 3195S, CST), vimentin (1:1,000, AF2105, R&D), BRMS1L (1:1,000, NBP2-14362, Novus),
Techniques:
Journal: Oncogene
Article Title: The human DEK oncogene stimulates beta catenin signaling, invasion and mammosphere formation in breast cancer
doi: 10.1038/onc.2011.2
Figure Lengend Snippet: A) Western blotting for DEK revealed high expression in ten breast cancer cell lines and the non-tumorigenic MCF10A immortalized human mammary epithelial cell line compared to two primary normal breast samples from separate donors. Actin was used as a loading control. The blot is over-exposed to emphasize low expression in normal tissue (B) A tissue microarray was stained for the DEK protein (brown) by immunohistochemistry. Normal, abnormal, and cancerous tissue are shown: (a) normal tissue, (b) hyperplasia, (c) fibrocystic changes, (d) grade I carcinoma in situ , (e) grade II-III, and (f) grade III invasive ductal carcinomas. Low power images are at 100x total magnification.
Article Snippet: Tissue sections from paraffin-embedded MDA-MB-468 NTsh xenograft tumors from the mammary gland were deparaffinized, underdwent antigen retrieval with 10 mM sodium citrate, and were blocked with 5% normal donkey serum and immunostained with
Techniques: Western Blot, Expressing, Microarray, Staining, Immunohistochemistry, In Situ

Journal: Oncogene
Article Title: The human DEK oncogene stimulates beta catenin signaling, invasion and mammosphere formation in breast cancer
doi: 10.1038/onc.2011.2
Figure Lengend Snippet: (A) MDA-MB-468, MCF10A, and MCF7 cells were retrovirally transduced with either empty vector (R780) or a DEK over-expression construct (R780:DEK). MDA-MB-468 and MCF7 cells were transduced with lentiviral shRNA constructs for non-targeting shRNA (NTsh) or two distinct DEK shRNAs (DEKsh2 or DEKsh5). Lysates were analyzed by Western blotting for DEK, cyclin A and Actin expression. (B) DEK over-expression significantly increases cellular growth rates in non-tumorigenic MCF10A cells and moderately increases growth rates in cancer cells. Population growth was monitored by plating equal numbers of control and DEK over-expressing cells then counting cell numbers over the course of five to seven days (p<0.05 in MCF10A cells, p=0.06 for MCF7 cells). (C) Loss of DEK expression inhibits growth in breast cancer cells. Population growth was monitored as in (B) immediately after selection in puromycin.. (D) Loss of DEK expression results in increased rates of apoptosis. MCF7 and MDA-MB-468 NTsh or DEKsh2 cells were stained for cleaved caspase 3 and analyzed by flow cytometry.
Article Snippet: Tissue sections from paraffin-embedded MDA-MB-468 NTsh xenograft tumors from the mammary gland were deparaffinized, underdwent antigen retrieval with 10 mM sodium citrate, and were blocked with 5% normal donkey serum and immunostained with
Techniques: Transduction, Plasmid Preparation, Over Expression, Construct, shRNA, Western Blot, Expressing, Selection, Staining, Flow Cytometry

Journal: Oncogene
Article Title: The human DEK oncogene stimulates beta catenin signaling, invasion and mammosphere formation in breast cancer
doi: 10.1038/onc.2011.2
Figure Lengend Snippet: (A) (Top) Loss of DEK expression impairs tumor growth in nude mice. MDA-MB-468 breast cancer cells transduced with lentiviral non-targeting shRNA (NTsh) or DEK shRNA (DEKsh2) were injected into the mammary fat pad of female nude mice (N=10 per cell line) and tumor growth was monitored with calipers for ten weeks. (Bottom) At necropsy, tumors were removed from the mammary gland and measured in three dimensions with calipers to calculate the final tumor volume (volume = (π/6)*(LxWxH)). (B) (Top) H&E images of representative tumors. T = tumor and N = necrosis. Arrows indicate normal mammary ducts. Immunohistochemical staining of tumors showed a correlation between DEK (middle panel) and ΔNp63 (bottom panel) staining. The H&E images are at 100x magnification. (Right) Western blotting of tumor lysates show down-regulation of ΔNp63 and upregulation of E-cadherin in DEKsh2 tumors. (C) DEKsh2 tumors had a higher percentage of cleaved caspase-3 positive cells, indicative of apoptosis, compared to NTsh-derived tumors. (Right) Representative immunohistochemistry images for caspase 3 staining. Arrows indicate representative positive cells. (D) DEKsh2 tumors had fewer BrdU-positive cells compared to NTsh-derived tumors. (Right) Representative immunohistochemistry images for BrdU staining. (E) Tumor cells exhibit co-expression of DEK with PCNA. Sections from paraffin-embedded NTsh derived tumors were immunolabelled for DEK (red) and PCNA (green).
Article Snippet: Tissue sections from paraffin-embedded MDA-MB-468 NTsh xenograft tumors from the mammary gland were deparaffinized, underdwent antigen retrieval with 10 mM sodium citrate, and were blocked with 5% normal donkey serum and immunostained with
Techniques: Expressing, Transduction, shRNA, Injection, Immunohistochemical staining, Staining, Western Blot, Derivative Assay, Immunohistochemistry, BrdU Staining
Journal: Cancers
Article Title: A Systemic and Integrated Analysis of p63-Driven Regulatory Networks in Mouse Oral Squamous Cell Carcinoma
doi: 10.3390/cancers15020446
Figure Lengend Snippet: Co-staining of p63 and COTL1 in B7E3 cells with induced p63 expression. Immunofluorescence images of p63 (green), COTL1 (red), and DAPI (blue) in B7E3 cells treated with no dox ( A ), 50 ng dox ( B ), or 200 ng dox ( C ).
Article Snippet: After blocking in 5% milk, the membranes were incubated first in primary antibodies against p63 (4A4, 1:20,000),
Techniques: Staining, Expressing, Immunofluorescence

Journal: Cancers
Article Title: A Systemic and Integrated Analysis of p63-Driven Regulatory Networks in Mouse Oral Squamous Cell Carcinoma
doi: 10.3390/cancers15020446
Figure Lengend Snippet: Co-immunofluorescence of p63 and COTL1 in human OSCC tissue. Two independent samples of well-differentiated, moderately differentiated, and poorly differentiated human OSCC tissues were co-stained for p63 (green) and COTL1 (red), and imaged at 20× magnification. DAPI (blue) was used as a nuclear stain.
Article Snippet: After blocking in 5% milk, the membranes were incubated first in primary antibodies against p63 (4A4, 1:20,000),
Techniques: Immunofluorescence, Staining

Journal: Cancers
Article Title: A Systemic and Integrated Analysis of p63-Driven Regulatory Networks in Mouse Oral Squamous Cell Carcinoma
doi: 10.3390/cancers15020446
Figure Lengend Snippet: Immunohistochemical staining in HNSCC tumor microarray tissues. Staining of p63 ( A ), COTL1 ( B ), and K14 ( C ) across normal, malignant tumor stage II, and malignant tumor stage III tissues at 10× magnification.
Article Snippet: After blocking in 5% milk, the membranes were incubated first in primary antibodies against p63 (4A4, 1:20,000),
Techniques: Immunohistochemical staining, Staining, Microarray
Journal: Scientific Reports
Article Title: MicroRNA-141-regulated KLK10 and TNFSF-15 gene expression in hepatoblastoma cells as a novel mechanism in liver carcinogenesis
doi: 10.1038/s41598-024-63223-4
Figure Lengend Snippet: Microarray analysis of transfected HepG2 cells with miR-141 overexpression and its predicted targets. ( A ) Microarray analysis of gene expression in HepG2 cells transfected with miR-141 overexpression vs. cells transfected with the control vector using a miRNA library from Exiqon. ( B ) Microarray analysis of gene expression in HepG2 cells transfected with miR-141 overexpression vs. cells transfected with the control vector using oligonucleotides from Ambion. The blue color indicates the sustained gene expression, the red color indicates the upregulated genes, and the green color indicates the downregulated genes. ( C ) The expression of the most relevant genes to liver cancer indicates the upregulated genes in red columns and downregulated genes in green. Error bars indicate the STD between Exiqon and Ambion data. ( D ) The potential seeding regions of hsa-miR-141 within the coding sequences and 3-UTR of KLK10 and TNFSF-15 gene sequences that carried out in-silico by miRWalk online tool.
Article Snippet: For primary antibody staining, the cells were resuspended and followed by overnight incubation at 4 °C in the PBS supplemented with 1% BSA and the diluted
Techniques: Microarray, Transfection, Over Expression, Expressing, Control, Plasmid Preparation, In Silico

Journal: Scientific Reports
Article Title: MicroRNA-141-regulated KLK10 and TNFSF-15 gene expression in hepatoblastoma cells as a novel mechanism in liver carcinogenesis
doi: 10.1038/s41598-024-63223-4
Figure Lengend Snippet: The correlation between the level of miR-141 and KLK10 and TNFSF-15 on gene expression level and protein level in HepG2 cells. ( A ) The relative gene expression of KLK10 and TNFSF-15 in HepG2 cells transfected with the inhibitor against miR-141 and miR-141 overexpression vector indicated by fold change compared with control-transfected and nontreated cells using qRT-PCR. Error bars indicate the STD of three independent experiments. Student two-tailed t -test used for statistical analysis , (*) indicates P-values ≤ 0.05, and (**) indicates P ≤ 0.01. ( B ) Flow cytometric assay quantifies the kinetic proteins expression profile of KLK10 (the blue dots) and TNFSF-15 (the red dots) in transfected cells compared with control-transfected and nontreated (NT) cells. ( C ) Western blot analysis shows the protein expression of KLK10 and TNF SF15 in transfected cells compared to control-transfected and nontreated cells. β-actin expression severed as an internal control. ( D and E ) Schematic representation of miR-141 binding sites and seeding regions (SR) in KLK10 and TNFSF-15 gene sequence indicated by IntaRNA program. ( F ) In HepG2 cells pre-transfected with miR-141 overexpressing vector or specific inhibitor, the luciferase activities upon cotransfection with luciferase reporter constructs, pGL3-KLK10 or pGL3-TNFSH-15 compared with cells cotransfected with pGL3-control vector. Error bars reveal the STD of three replicates. Student two-tailed t -test used for statistical analysis, (*) indicates P- values ≤ 0.05, and (**) indicates P ≤ 0.01.
Article Snippet: For primary antibody staining, the cells were resuspended and followed by overnight incubation at 4 °C in the PBS supplemented with 1% BSA and the diluted
Techniques: Expressing, Transfection, Over Expression, Plasmid Preparation, Control, Quantitative RT-PCR, Two Tailed Test, Flow Cytometry, Western Blot, Binding Assay, Sequencing, Luciferase, Cotransfection, Construct

Journal: Scientific Reports
Article Title: MicroRNA-141-regulated KLK10 and TNFSF-15 gene expression in hepatoblastoma cells as a novel mechanism in liver carcinogenesis
doi: 10.1038/s41598-024-63223-4
Figure Lengend Snippet: Quantification analysis of KLK 10 and TNFSF-15 in transfected HepG2 cells.
Article Snippet: For primary antibody staining, the cells were resuspended and followed by overnight incubation at 4 °C in the PBS supplemented with 1% BSA and the diluted
Techniques: Transfection, Expressing, Control

Journal: Scientific Reports
Article Title: MicroRNA-141-regulated KLK10 and TNFSF-15 gene expression in hepatoblastoma cells as a novel mechanism in liver carcinogenesis
doi: 10.1038/s41598-024-63223-4
Figure Lengend Snippet: Detailed of selected interaction between miR-141 and targeted genes.
Article Snippet: For primary antibody staining, the cells were resuspended and followed by overnight incubation at 4 °C in the PBS supplemented with 1% BSA and the diluted
Techniques:

Journal: Scientific Reports
Article Title: MicroRNA-141-regulated KLK10 and TNFSF-15 gene expression in hepatoblastoma cells as a novel mechanism in liver carcinogenesis
doi: 10.1038/s41598-024-63223-4
Figure Lengend Snippet: The schematic representation of KLK10 and other proteins interaction. The colored nodes meant the direct interaction/s. The shortlisted targeted genes by miR-141 were selected from the microarray and subjected to Search Tool for the Retrieval of Interacting Genes (STRING) 12 version database analyses. STRING constructed a network model that allows displaying the interaction of all proteins. This analysis is connected to the KEGG and the Gene Ontology (GO) databases to cluster the shortlisted genes as input into various pathways and biological processes. (The red line indicates the presence of fusion evidence, the green line refers to the neighborhood evidence, the blue line shows the co-occurrence evidence, the purple line indicates the experimental evidence, the yellow line refers to the mining evidence, the light blue line suggests the database evidence and black line indicates the co-expression evidence).
Article Snippet: For primary antibody staining, the cells were resuspended and followed by overnight incubation at 4 °C in the PBS supplemented with 1% BSA and the diluted
Techniques: Microarray, Construct, Expressing
Journal: Nature Communications
Article Title: Apoptosis of intestinal epithelial cells restricts Clostridium difficile infection in a model of pseudomembranous colitis
doi: 10.1038/s41467-018-07386-5
Figure Lengend Snippet: Pyrin is not expressed in IECs. a Public microarray dataset of Mefv expression profile across different cell types and tissues. Expression values relate to fluorescence intensity from Affymetrix chips. b Real time qPCR of Mefv expression in different tissues and cell types. c Cell lysates from primary intestinal organoids of wild-type and Mefv -−/− mice were prepared and immunoblotted for total Pyrin and β-actin. d Primary intestinal organoids wild-type mice were stimulated with TcdA, TcdB or FlaTox and PI incorporation analyzed by live-imaging for 16 h. e Primary intestinal organoids wild-type mice were stimulated with TcdA, TcdB or FlaTox for 16 h and culture supernatant was analyzed for IL-18 secretion. Scale bars: 30 µm. Data are representative of 3 independent experiments
Article Snippet: Cell death was induced with
Techniques: Microarray, Expressing, Fluorescence, Imaging

Journal: Nature Communications
Article Title: Apoptosis of intestinal epithelial cells restricts Clostridium difficile infection in a model of pseudomembranous colitis
doi: 10.1038/s41467-018-07386-5
Figure Lengend Snippet: Apoptotic executioner caspases 3 and 7 are critical for C. difficile toxins-induced IEC death. a , b Wildtype (WT) primary intestinal organoids were stimulated with a TcdA and TcdB for 16 h or staurosporine for 3 h, or b infected with a toxigenic and non-toxigenic strain of C. difficile for 16 h. Cell lysate was prepared and immunoblotted for caspase-3, caspase-7, PARP and tubulin. c Cell lysates from primary intestinal organoids of Casp3/7 F/F and Casp3/7 IEC-KO mice were prepared and immunoblotted for caspase-3, caspase-7 and β-actin. d , e Primary intestinal organoids from Casp3/7 F/F and Casp3/7 IEC-KO mice were stimulated with TcdA ( d ) or TcdB ( e ) and PI incorporation analyzed by live-imaging for 16 h. Graphs correspond to PI quantification plotted by organoid area. Scale bars: 30 µm. The data are representative of 3 independent experiments
Article Snippet: Cell death was induced with
Techniques: Infection, Imaging
Journal: Immunity
Article Title: Human Secretory IgM Emerges from Plasma Cells Clonally Related to Gut Memory B Cells and Targets Highly Diverse Commensals
doi: 10.1016/j.immuni.2017.06.013
Figure Lengend Snippet:
Article Snippet: Human sorted intestinal naive and ME-M B cells (1 × 10 5 /well) were seeded in 96-well U-bottomed plates (Thermo Fisher) and cultured for 6-7 days in complete RPMI 1640 medium (Thermo Fisher) supplemented with 10% FBS, penicillin and streptomycin (10 U/ml) with or without 200 ng/ml
Techniques: Recombinant, Blocking Assay, Fluorsave, Giemsa Stain, Sample Prep, DNA Purification, SYBR Green Assay, Microarray, Transformation Assay, Software